
![Blue or Green Screen Effect with OpenCV [Chroma keying]](../content/images/size/w2000/2020/05/1_PEELIgKtt9V_Q7heJFNy-g.png)
Jump to Code with .ipynb
Before we get into Chroma keying[ green screen effect ] it’s better to understand the underlying concept that making it possible with Open CV.
Colour Thresholds
As we treat Images as grids of pixels as a function of X and Y, we are gonna use that information of colors to isolate a particular area.selecting areas of intrest. we’ll be selecting an area of interest using Colour Thresholds,
With Colour Thresholds we can able to remove parts of an image that falls under a specific color range. The common use is with Blue/Green Screen.
A Blue Screen similar to a green screen is used to layer two images or video streams based on identifying and replacing a large blue area.
We’re gonna use Blue Screen to film now ;p. So, how does it work?
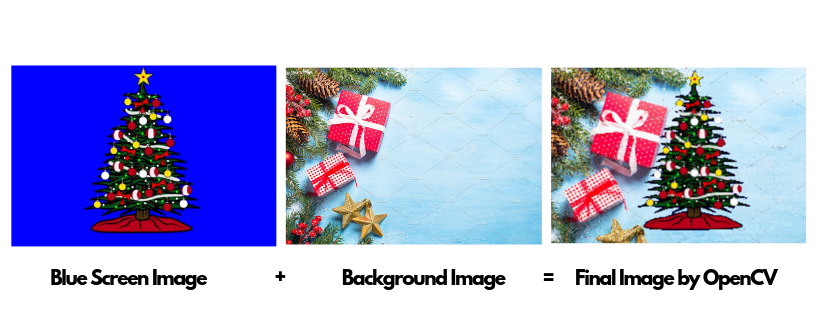
The first step is to isolate the blue background and replace that blue area with an image of your choosing.

We’ll be starting with an image of a Christmas tree on a Blue screen background.
We first have to identify the blue region then later we’ll replace it with a background image of our choosing.
import cv2
import matplotlib.pyplot as plt
import numpy as np
image = cv2.imread('images/ctree_bluescreen.jpg')
cv2.imread() is used to read an image which takes the image location as an argument, where the image ctree_bluescreen.jpg is in the folder called images.
print('Image type: ', type(image),
      'Image Dimensions : ', image.shape)
This gives you the result as :
Image type: <class ‘numpy.ndarray’> Image Dimesnsions: (720, 1280, 3)
The openCV library reads the image as an array, also known as a grid or matrix of pixel values. The shape of the image, which contains three values that represent the dimensions of the image array,
720: height in pixels
816: width in pixels
3: Colour Components for Red, Green and Blue (RGB) valuesimage_copy = np.copy(image)
image_copy = np.copy(image)
image_copy = cv2.cvtColor(image_copy, cv2.COLOR_BGR2RGB)
plt.imshow(image_copy)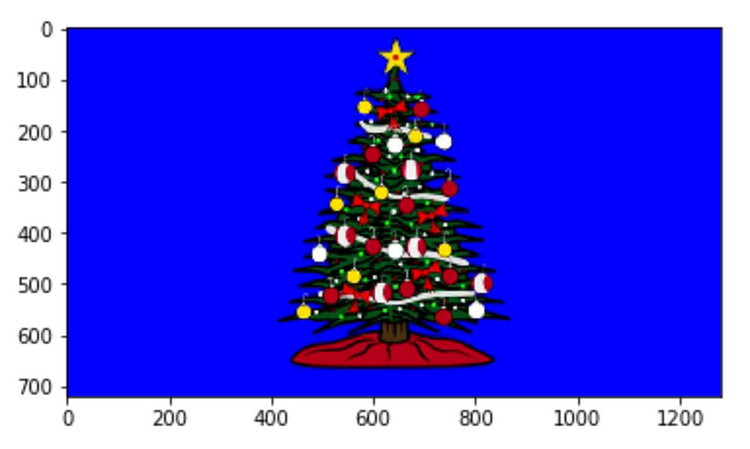
Open CV reads in colour images as BGR(blue, green, red) images, not as RGB(red, blue, green). So, the Red and Blue colours are in reverse order and pyplot reflect this switch and results in a differently coloured image than original.
So, before we display the image let’s make a copy of the original image and use Open CV to change colour from BGR to RGB. It’s good practice to always make a copy of the image you’re working with. This way any transformation you’ll apply to the copy will not affect the original image, so it’s easier to undo a step or try something new.
Now, on this copied image image_copy we can perform a colour transformation using Open CV function cvtColor() , this takes a source image and colour conversion code, in this case, it is just BGR2RGB and then outputs the desired image.
Defining the Colour Threshold
Now, we need to create a colour threshold to remove the desired blue region.
To create a Colour Threshold, we need to define lower and upper bounds for the colour that we need to isolate and remove -blue
we’ll be using the colour threshold values to eventually select the blue screen area that contains this range of colour values and get rid of it.
lower_blue = np.array([0, 0, 100])     ##[R value, G value, B value]
upper_blue = np.array([120, 100, 255])
So, we defined the low threshold that contains the lowest values of red, green and blue that are still considered part of the blue screen background.
In lower_blue , for red and green, we set as 0, meaning it’s okay to have no red or green. But, the lowest value for blue should still be quite high, let’s say around 100.
Now, for upper_bluedefined the upper threshold to allow little more red and green, and set the highest value for blue to 255. Any colour within this low and high range will be an intense blue colour. this is just an estimation though. So, if we find that this range isn’t finding the blue screen area we want, we can get back and change the values.
Creating a Mask
We are gonna use the colour bound that are just created to create an image mask.
Masks are very common way to isolate a selected area of intrest and do something with that area. We can create a mask over blue area using Open CV’s inRange() function.
mask = cv2.inRange(image_copy, lower_blue, upper_blue)
plt.imshow(mask, cmap='gray')
The inRange() function takes in an image in our lower and upper colour bounds and defines a mask by asking if the colour value of each image pixel falls in the range of the lower and upper colour thresholds. If it does fall in this range, the mask will be allowed to be displayed and if not it will block it out and turn the pixel black.
In fact, we can visualize the mask by plotting it as we would an image.
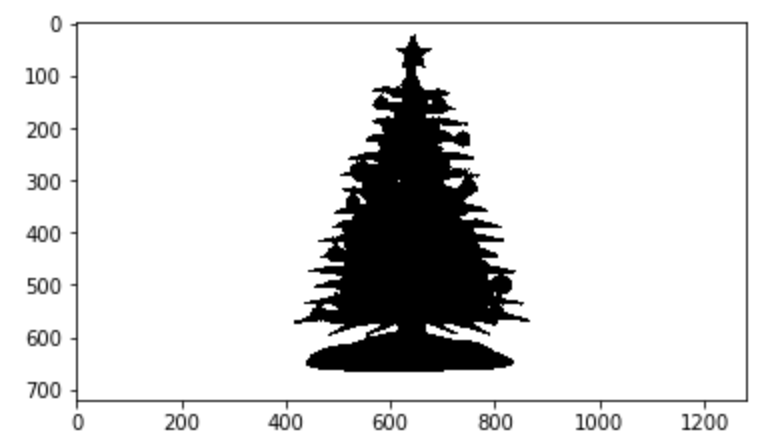
The whole white area is where the image will be allowed to show through and the black will be blocked out. In numerical values, we can look at this mask as a 2D grid with the same dimensions as our image 720 pixels in height and 816 pixels in width.
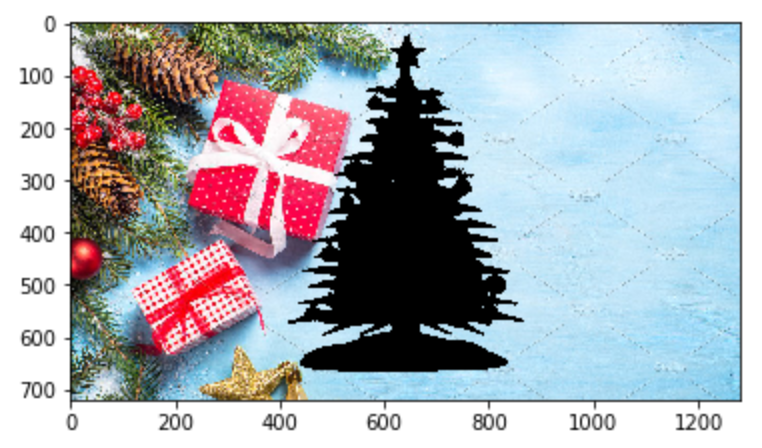
Each coordinate in the mask has a value of either 255 for white and 0 for black, sort of like a grayscale image. And when we look at this mask we can see that it has a white area where the blue screen background is and the black area where the Christmas tree is.
Now, the first thing we need to do is let the Christmas tree show through and block the blue screen background.
masked_image = np.copy(image_copy)
masked_image[mask != 0] = [0, 0, 0]
plt.imshow(masked_image)
First, to mask the image we are gonna make another image copy called maksed_image of our colour changed image copy, just in case I want to change the mask later on.
Then one way to select the blue screen is by asking for the part of that image that overlaps with the part of the mask that is white or not black. That is we’ll select the part of the image where the area of the mask is not equal to zero, using mask != 0 . And to block this background area out we then set the pixels to black. Now when we display our result, that should show the Christmas tree area is the only area that should show through.
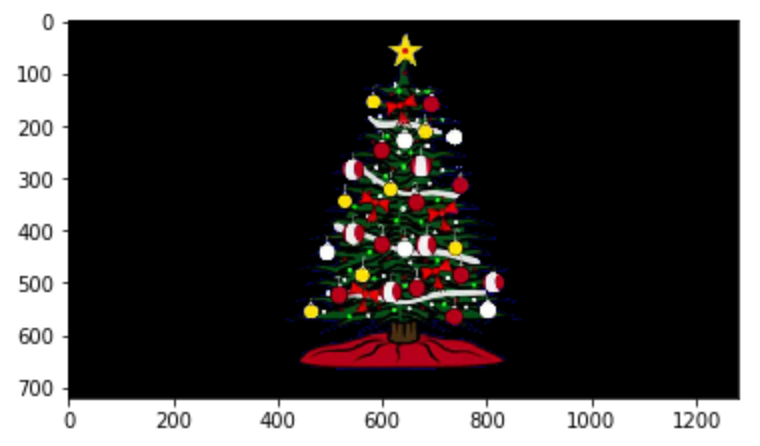
The Blue screen background is gone, we might even change our colour threshold to get rid of any few blue spots, we can try it by increasing the highest green value and decreasing the low blue value, that should capture a larger range of blue.
Mask and Add Background Image
Now, we just have one last step which is to apply a background to this image. The process is fairly similar.
background_image = cv2.imread('images/treeBackground.jpg')
background_image = cv2.cvtColor(background_image, cv2.COLOR_BGR2RGB)

crop_background = background_image[0:720, 0:1280]

crop_background[mask == 0] = [0, 0, 0]

plt.imshow(crop_background)
First, we’ll read in an image of outer space and convert into RGB Colour. We’ll also crop it so that it’s the same size as our tree image 720 x 1280 pixels , we are calling this image as crop_background , then we apply the mask, this time using the opposite mask, mean we want the background to show through and not the Christmas tree area. If we look back at the mak in this case we’re blocking the part of the background image where the mask is equal to zero.
Just to make sure we got this masking correct, we’re gonna plot the resulting image.
The result is the background with the Tree cut out.
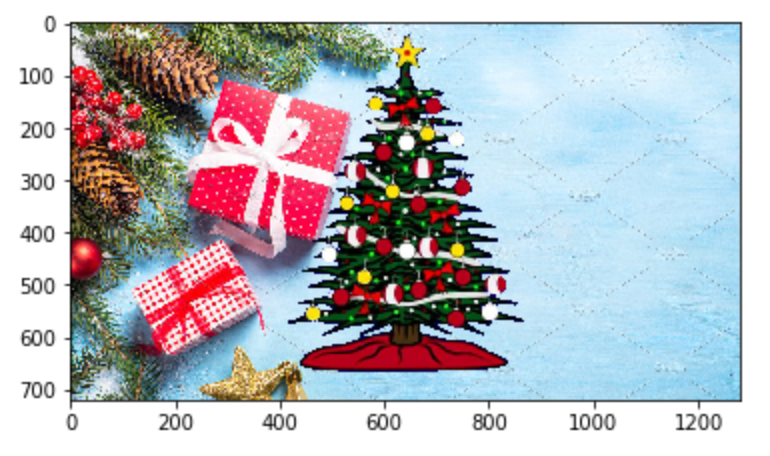
Then finally, we just need to add these two images together. Since the black area is equivalent to zeros in pixel colour value, a simple addition will work.
final_image = crop_background + masked_image
plt.imshow(final_image)
Now, when we plot the complete image I got the Christmas tree with new Background.🙌
Originally Published at: Medium